This article is to show how to create an alarm to monitor the metric of an instance's CPU and notify via email.
REF: https://www.youtube.com/watch?v=mcV1idfCXOo
Basic understanding of CloudWatch
What is CloudWatch? Why should we use CloudWatch?
CloudWatch is a monitoring service provided by AWS that helps us monitor and manage the performance, logs, and metrics of AWS resources and applications.
We can use CloudWatch to collect, store, and monitor a variety of performance metrics for AWS resources and applications, such as CPU utilization, network traffic, number of requests, error rates, and more. We can also use CloudWatch to monitor logs in real-time, as well as set up alerts and notifications to identify and resolve any issues in a timely manner.
Using CloudWatch helps us better understand the health of our applications and infrastructure, improve availability and performance, and identify and resolve potential issues in a timely manner, thus improving user experience and business value.
What are metrics in CloudWatch?
In AWS CloudWatch, a metric is a collection of time-dependent data points that represent a performance metric value for a specific resource. For example, an AWS EC2 instance's CPU utilization, network traffic, etc., can be monitored using CloudWatch Metrics. Metrics can be predefined Metrics that come with AWS or custom Metrics that are created by sending data to the CloudWatch Metrics interface. Metrics provides information about the system's operational status, state, and usage; it is a visual representation of the overall system health to better understand the system's operation and provide troubleshooting support.
2.1 What types of CloudFormation metrics are included?
Metrics in CloudWatch are organized into the following categories:
AWS Infrastructure Services Metrics: These Metrics come from various AWS infrastructure services, such as Amazon EC2, Amazon RDS, Amazon S3, and so on, and can be used to monitor the performance, availability, and health status of these services, among others.
Custom Metrics: These are user-created metrics, either from applications, operating systems, or metrics that are not automatically available on AWS services.
Logging Metrics: These Metrics are extracted from CloudWatch Logs and can be used to monitor application and operating system logging information.
Each Metric has a Namespace and a Metric name, as well as an optional Dimension. Users can obtain Metric data by specifying the Namespace, Metric name, and Dimension.
2.2 How can we use metrics?
Monitor the CPU utilization of EC2 instances: CloudWatch metrics allow us to monitor the CPU utilization of EC2 instances so that we can understand the load of EC2 instances and make timely adjustments. We can create a custom metric in the CloudWatch console and install the CloudWatch Agent on the EC2 instance to report the CPU utilization data to the CloudWatch metrics, and then we can query the CPU utilization data of the specified EC2 instance through the CloudWatch console or API. After that, we can query the CPU utilization data of the specified EC2 instance through the CloudWatch console or API, and create alerts to send notifications when the CPU utilization reaches the preset threshold.
Monitor the operation of Lambda functions: CloudWatch metrics allow us to monitor the operation of Lambda functions, such as the number of calls, execution time, and so on. We can add CloudWatch metrics to a Lambda function to record the operation of the Lambda function, then query the operation of the specified Lambda function through the CloudWatch console or API, and create alerts to send notifications when the function executes with errors or timeouts. This helps us to identify and resolve problems with the Lambda function in a timely manner to ensure its proper operation.
What are periods, namespace, dimensions, and statistics?
Periods: Specifies the temporal granularity of the metric, i.e. how often a data point is generated. For example, a 1-minute period will generate a data point every minute. The available periods are 1 second, 5 seconds, 10 seconds, 30 seconds, 1 minute, 5 minutes, 10 minutes, 15 minutes, and 1 hour.
Namespace: Namespace for the metric, used to organize and differentiate metrics, which can be grouped by application name, environment, service, etc. For example, a metric named "ASP.NET" can be grouped by the application name, environment, service, and so on. For example, a namespace named "AWS/EC2" is the default namespace for Amazon EC2 services.
Dimensions: Attributes used to uniquely identify a metric. Think of dimension as the "key" of a metric. dimension is a name/value pair, such as "InstanceID=i-0123456789abcdef", which can help identify and filter specific metric data. A metric can have multiple dimensions, for example, the CPU utilization metric of an EC2 instance can be identified by multiple dimensions, including InstanceID, AutoScalingGroupName, ImageId, and so on.
Statistics: Specify how the metric is summarized, including maximum, minimum, average, sum, etc. These summaries are based on the metric data. These summarized values are generated based on the metric data and can be used for statistics, monitoring and diagnosis of system performance.
In summary, by specifying the namespace, dimension, period, and statistics, you can obtain specific metric data and analyze and monitor it.
How to use the UI to create an alarm that can be used to monitor an instance based on its performance?
Step 1: Launch a new instance
Go to instances→ launch instance
1.1 Selecting a system image
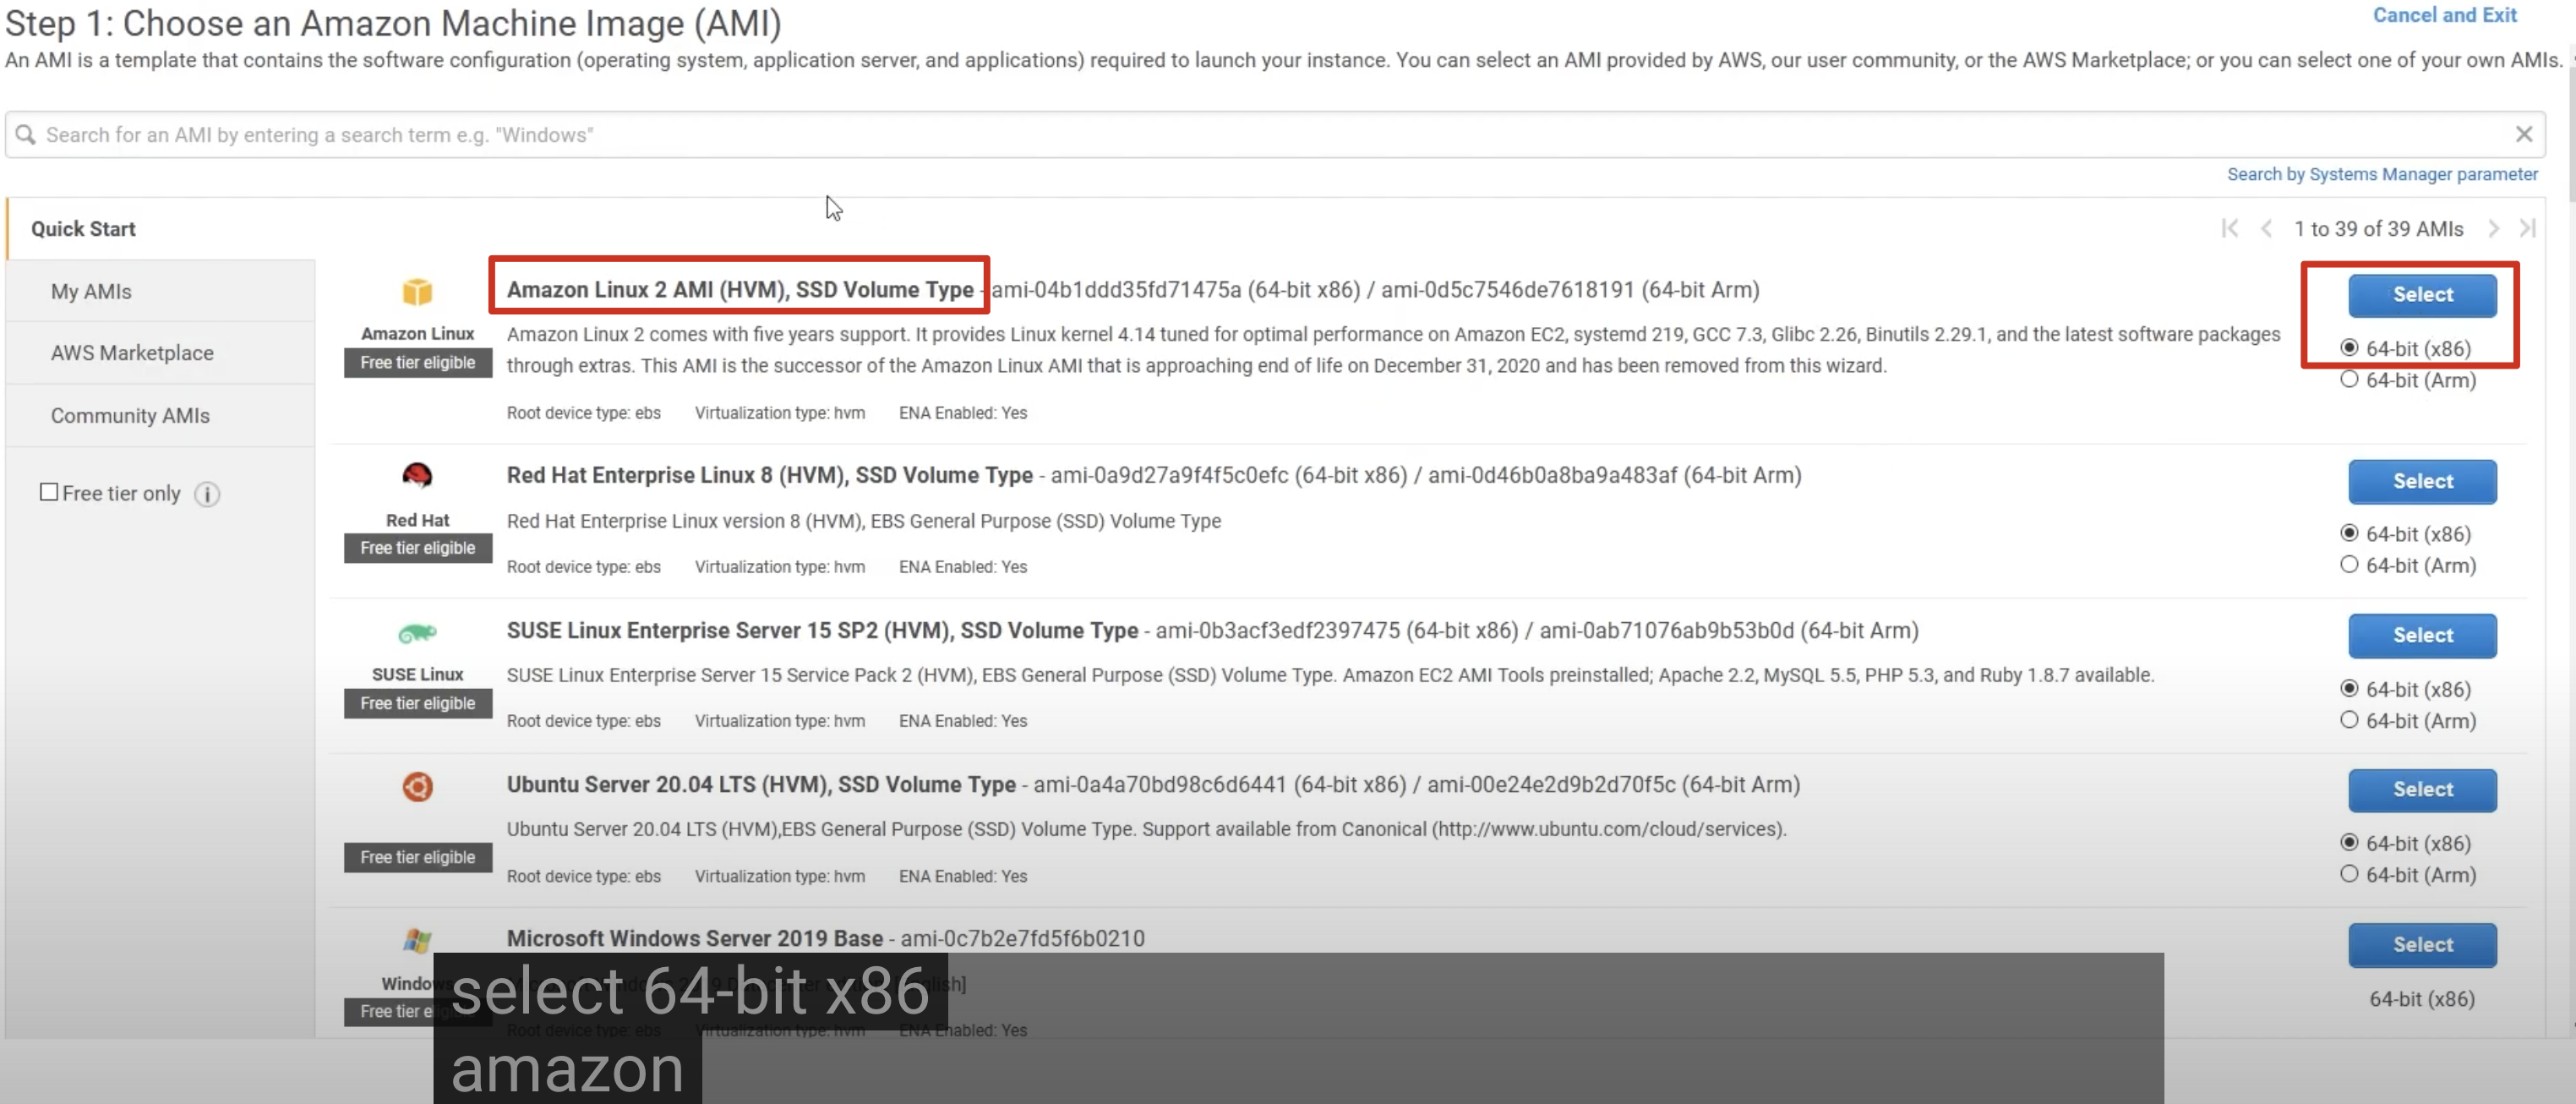
1.2 Select the type of instance
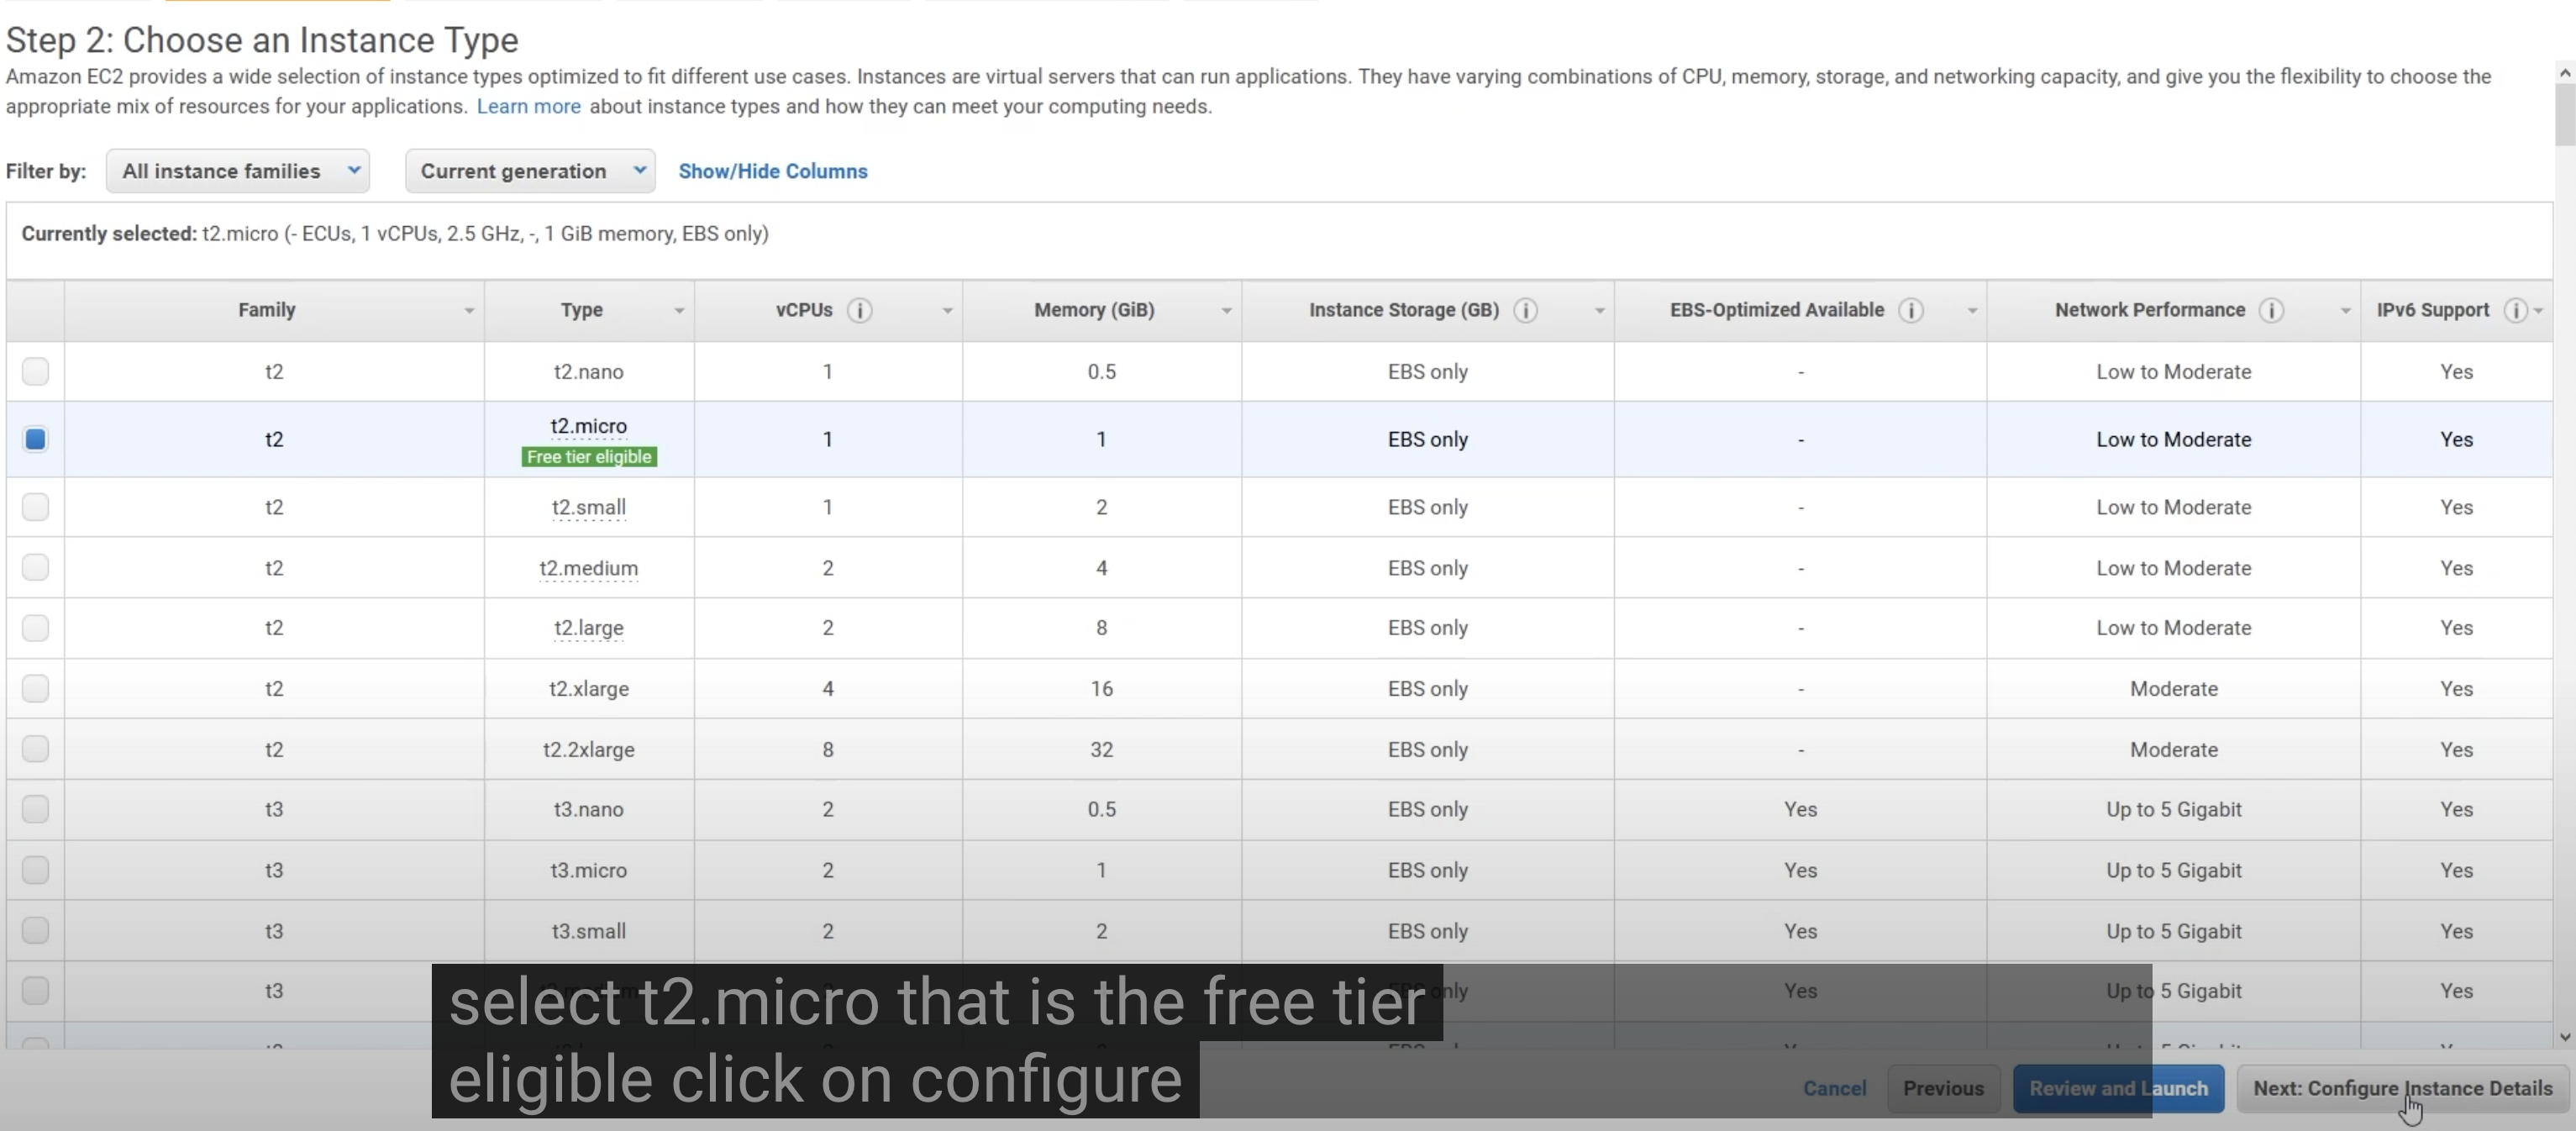

Create another key pair
Step 2: Add an alarm to monitor instance cpu
alarm+metrics+period+confirm action trigger mode
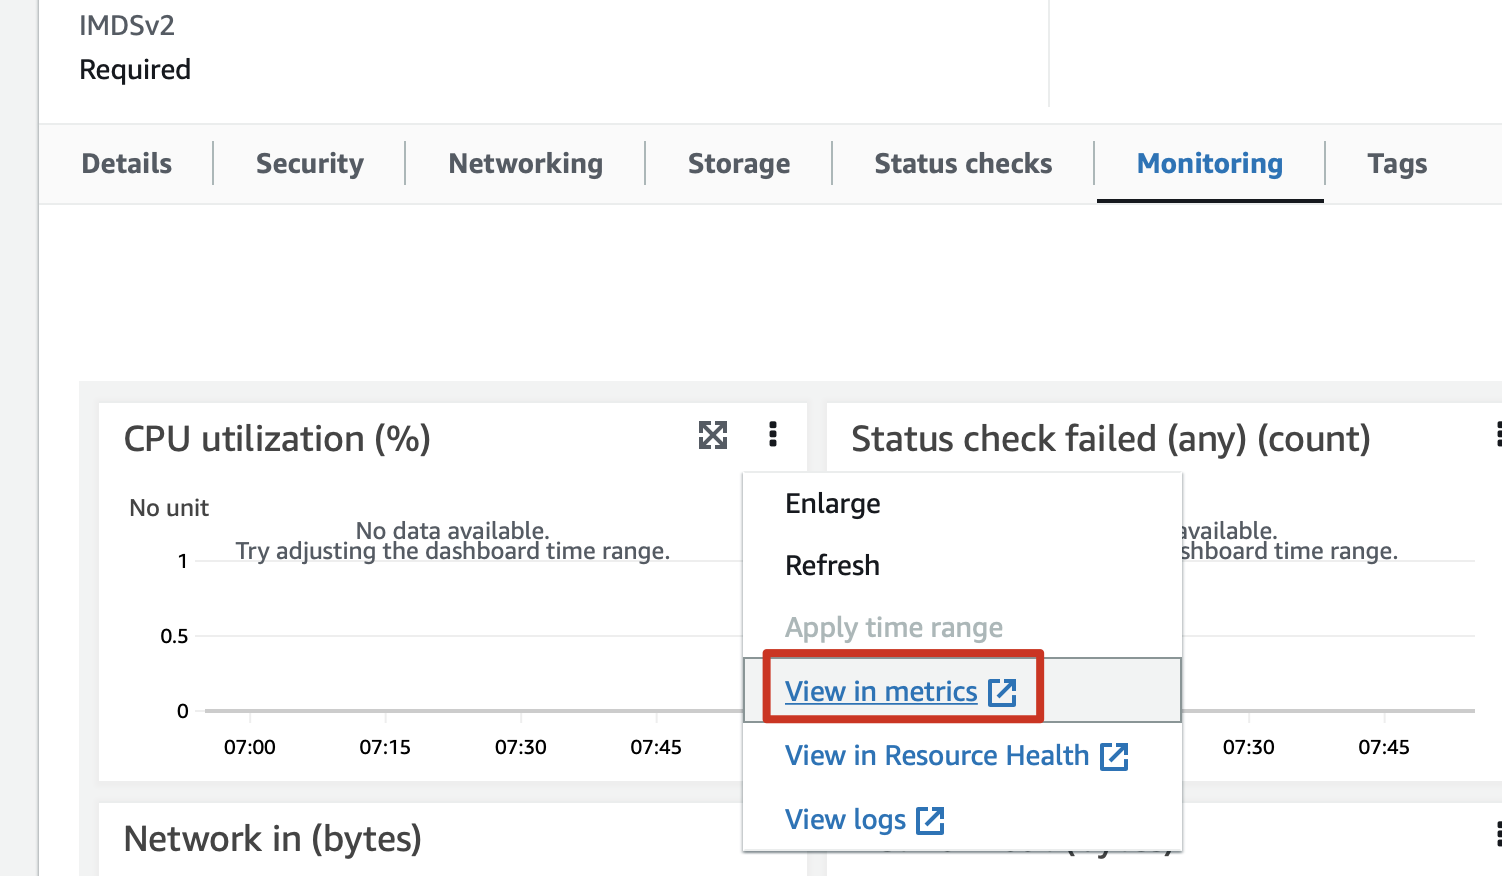
2.1 View CPU monitoring in metrics
instances→monitoring→cpu→view in metrics
2.2 Click trumpet ready to add an alarm or select Create an alarm in the navigation bar.
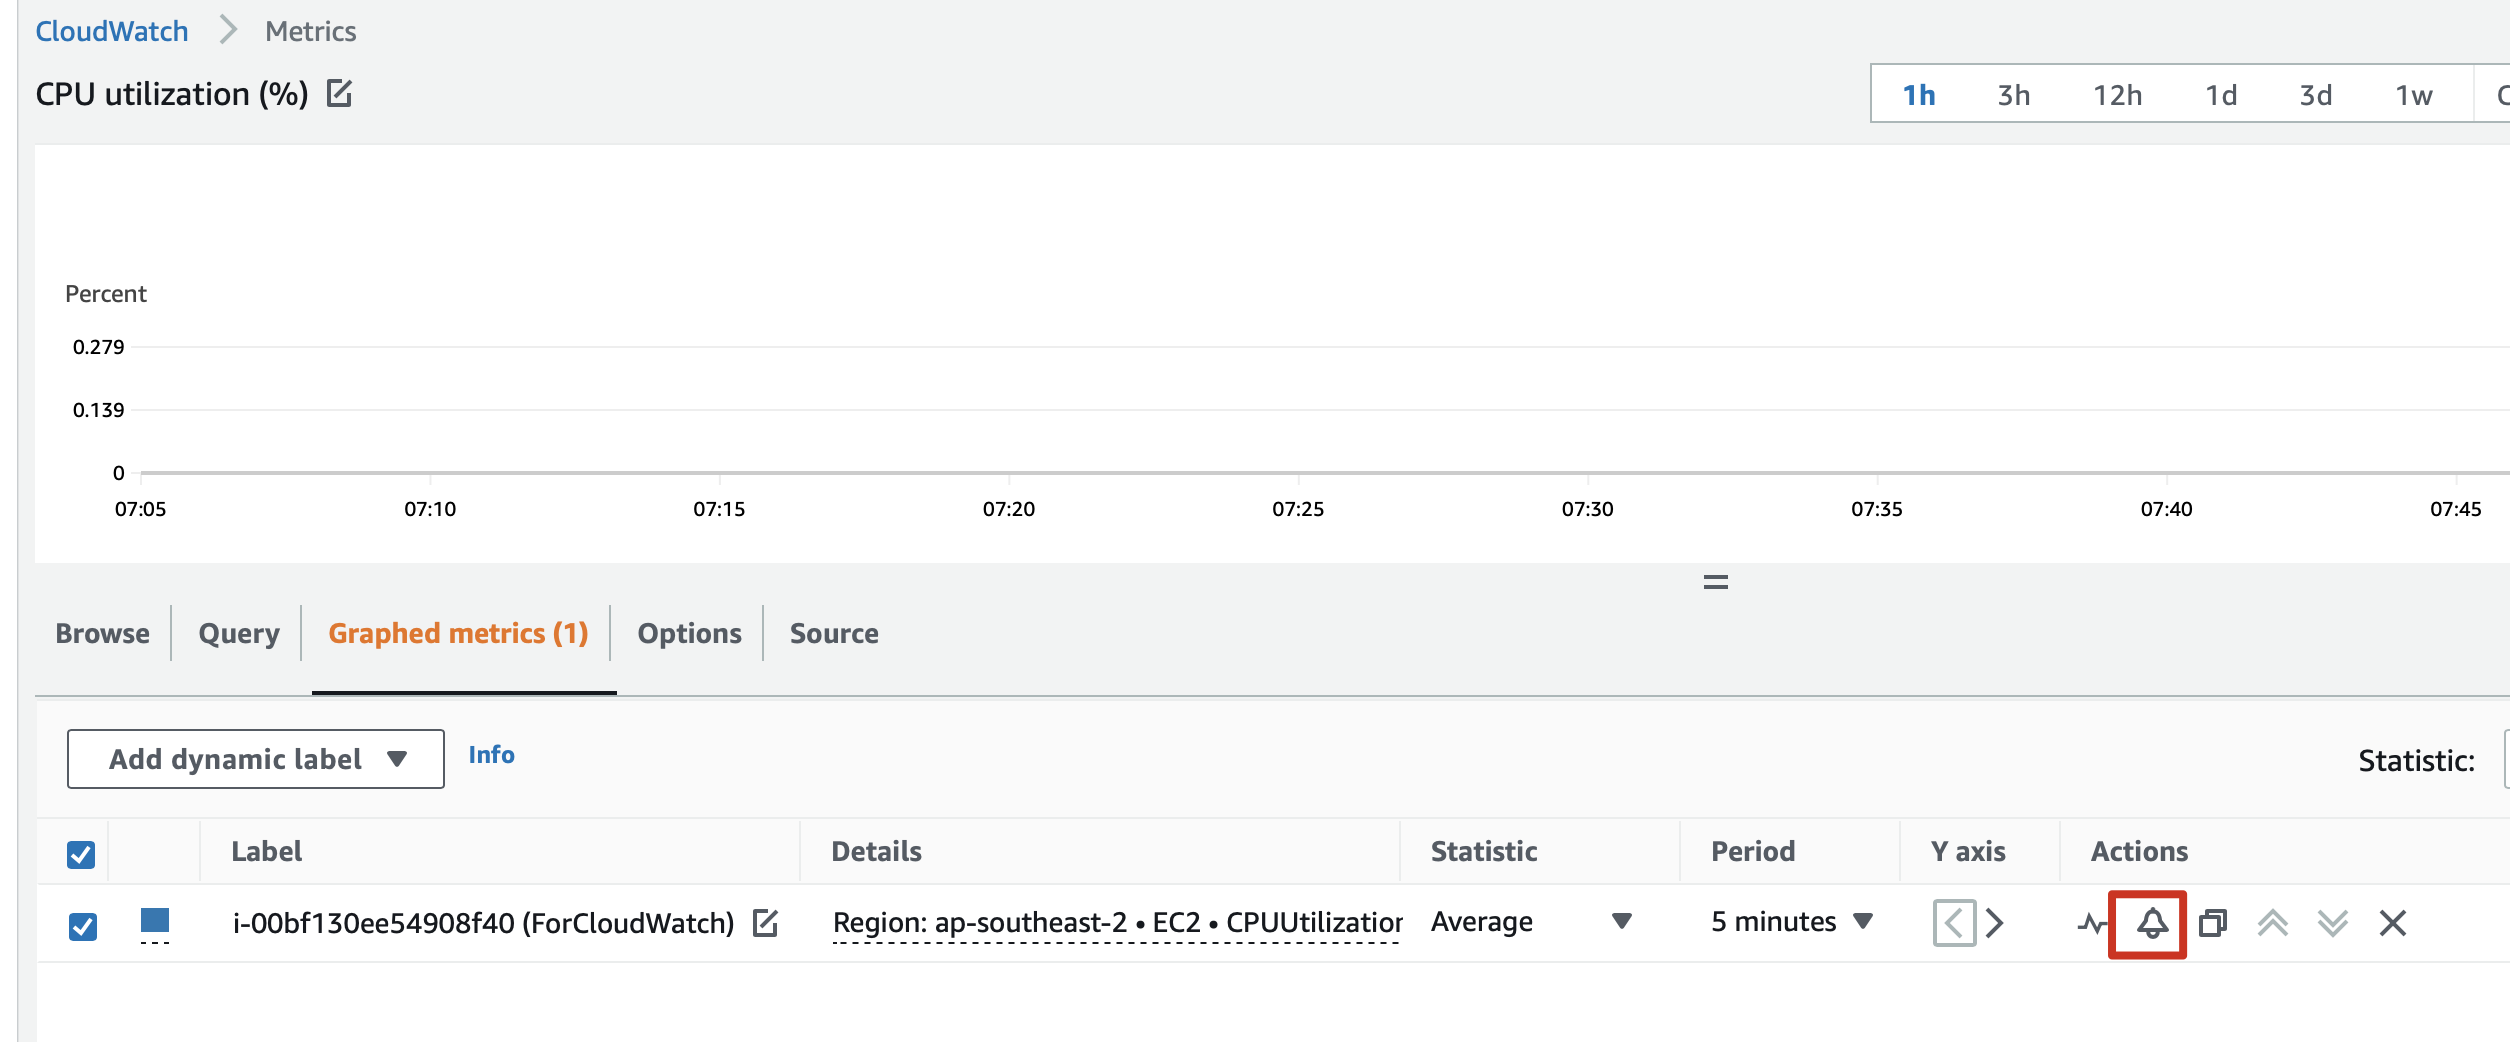
or

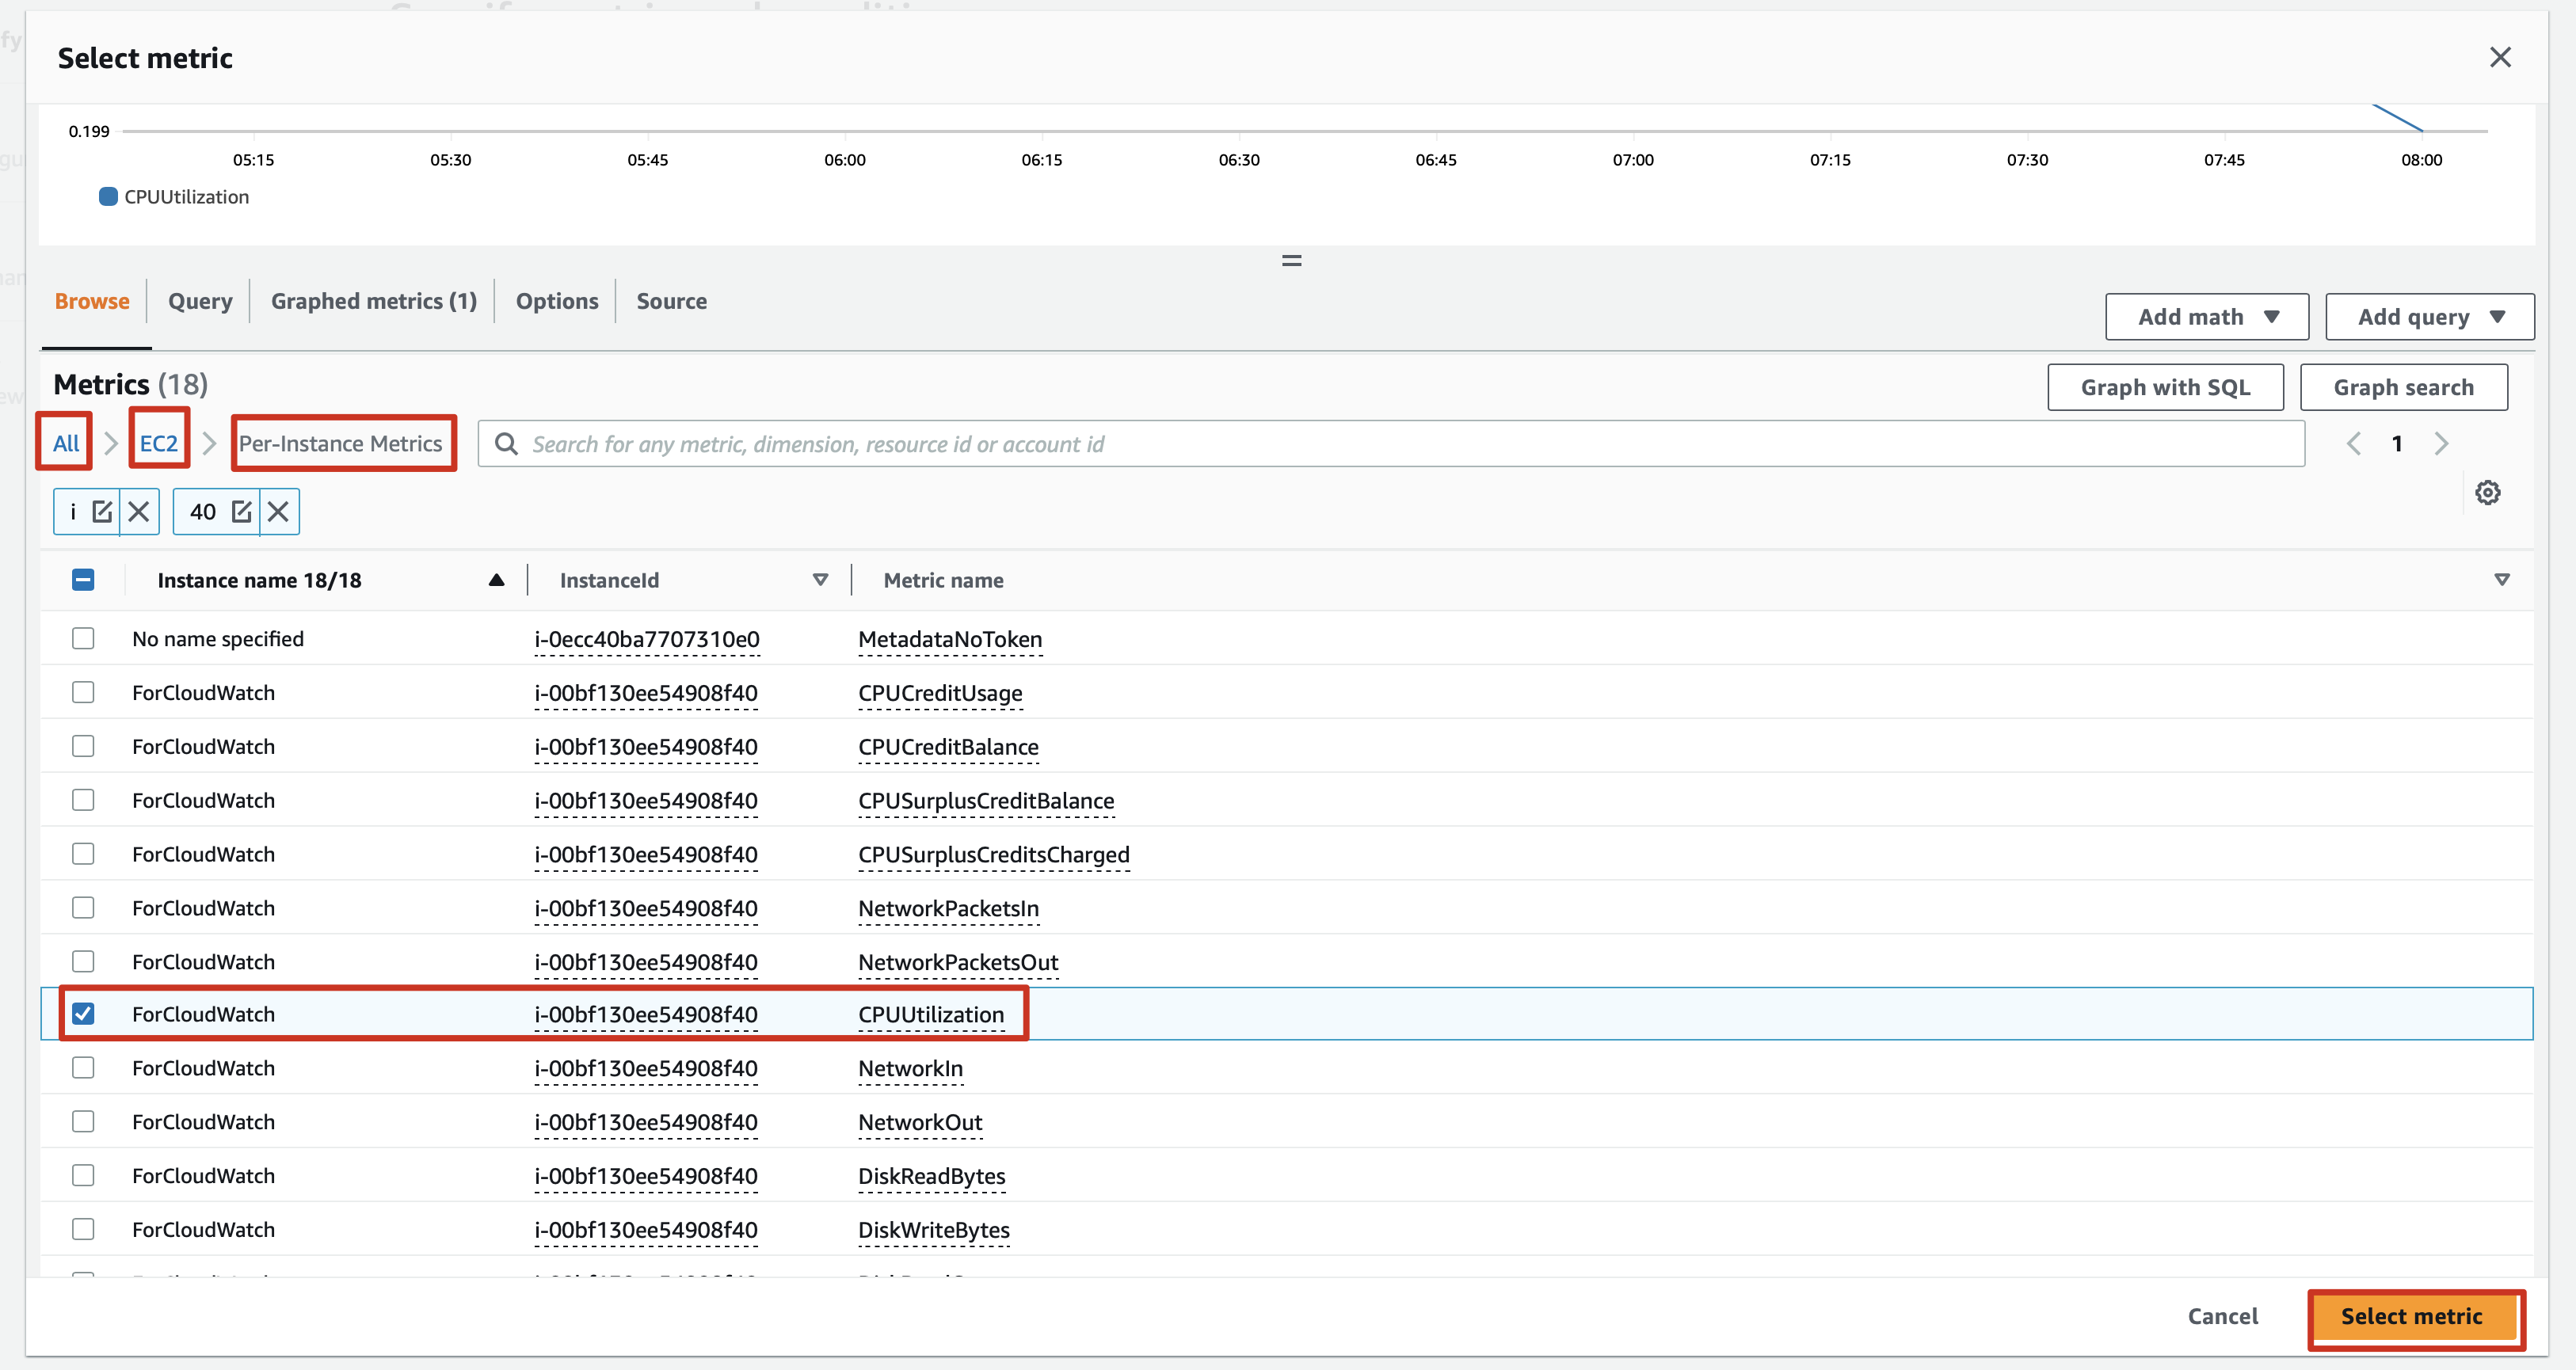
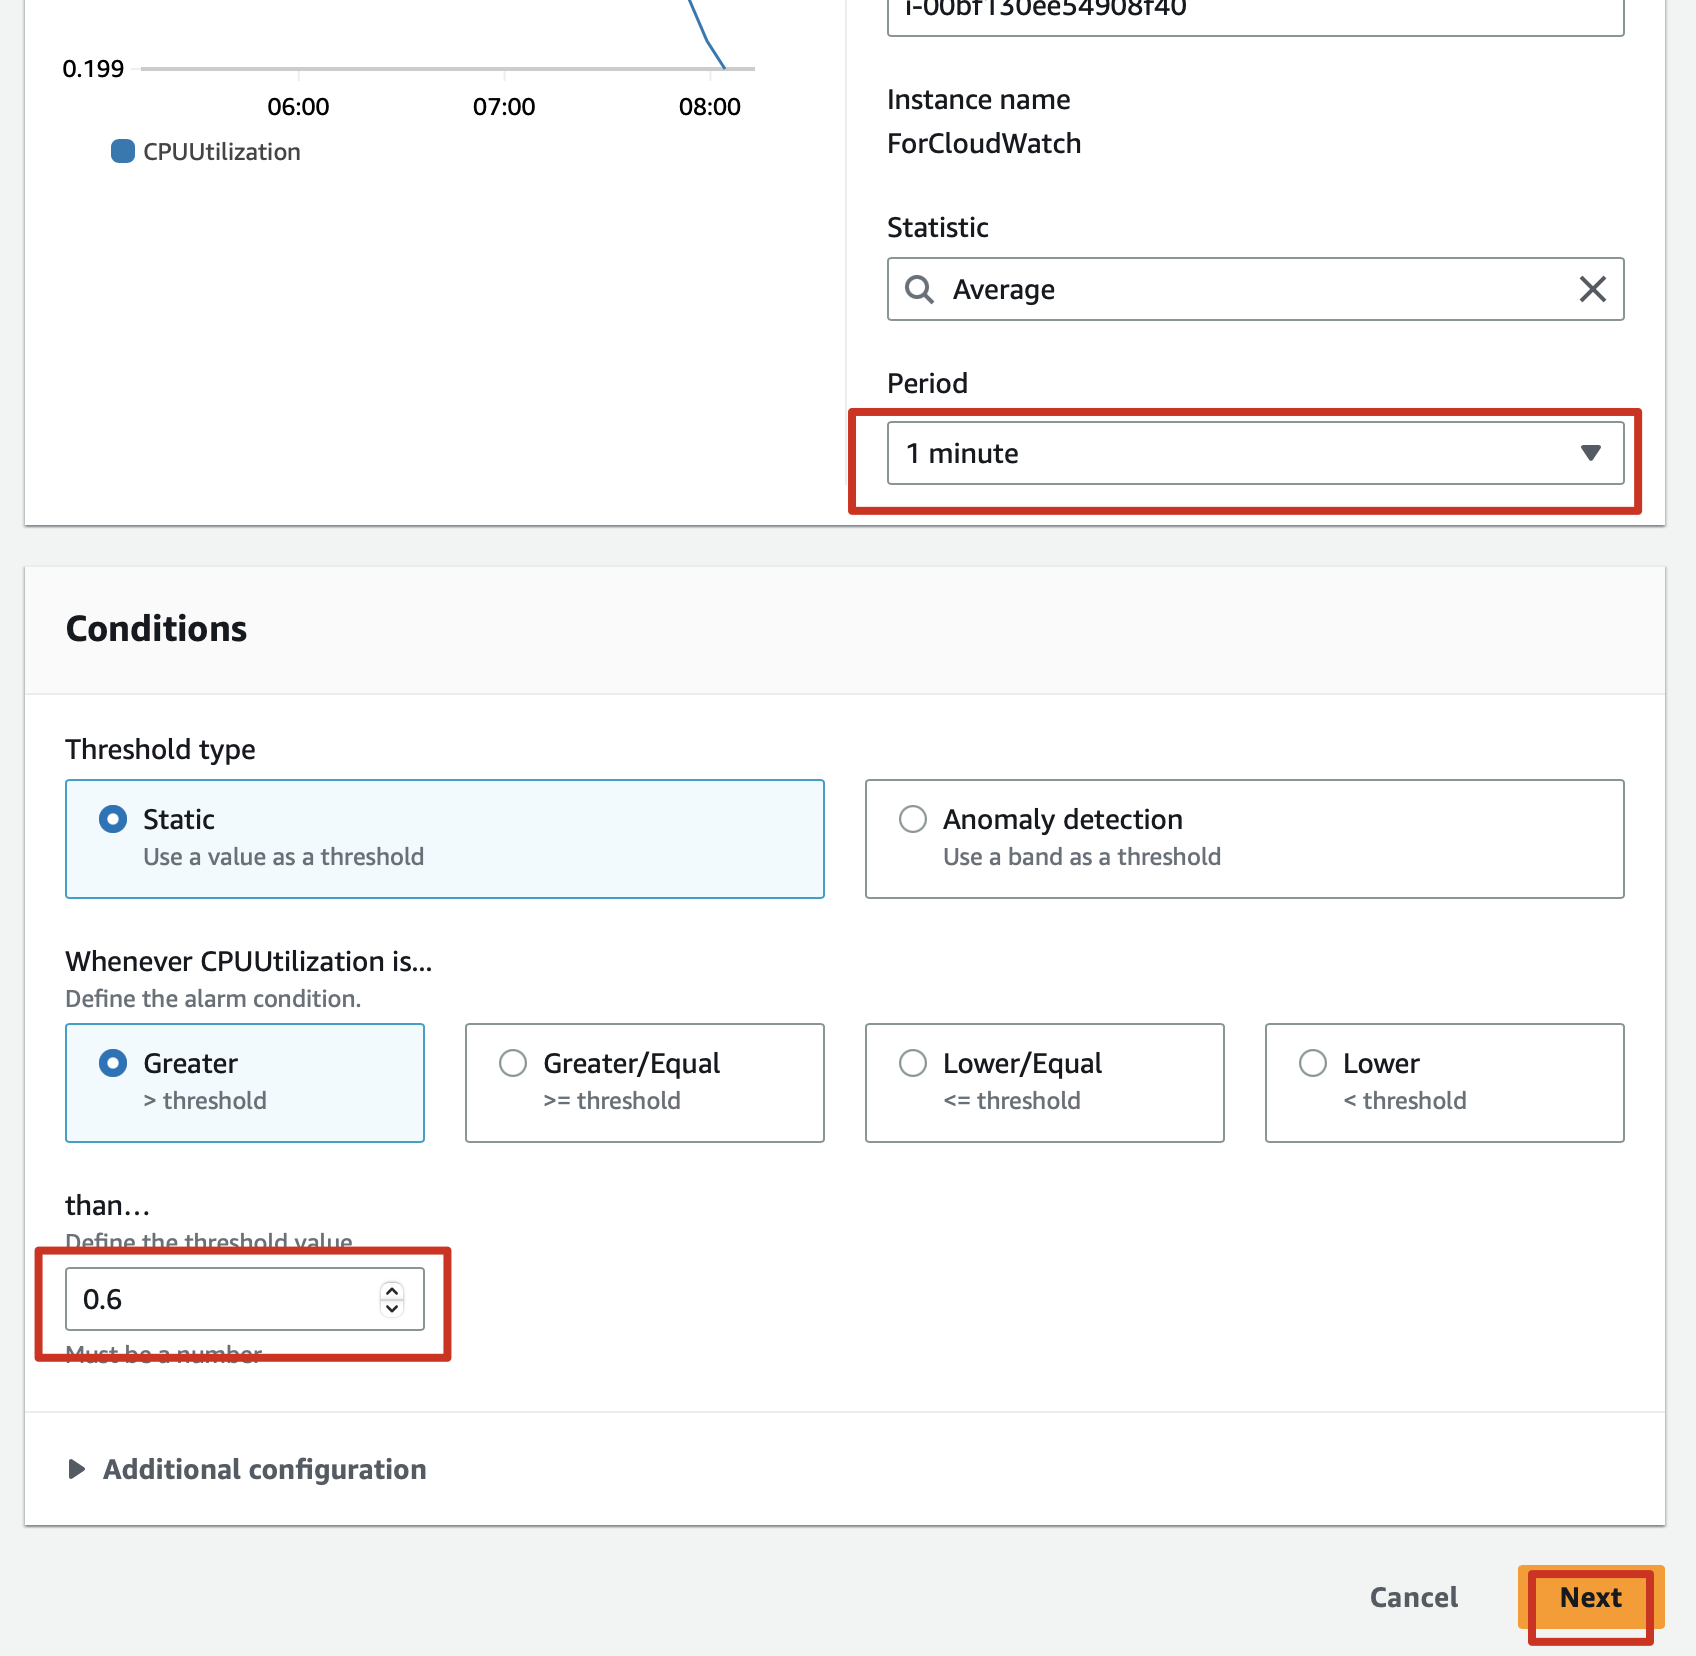
2.3 Period of 1 minute means one minute to reach threshold.
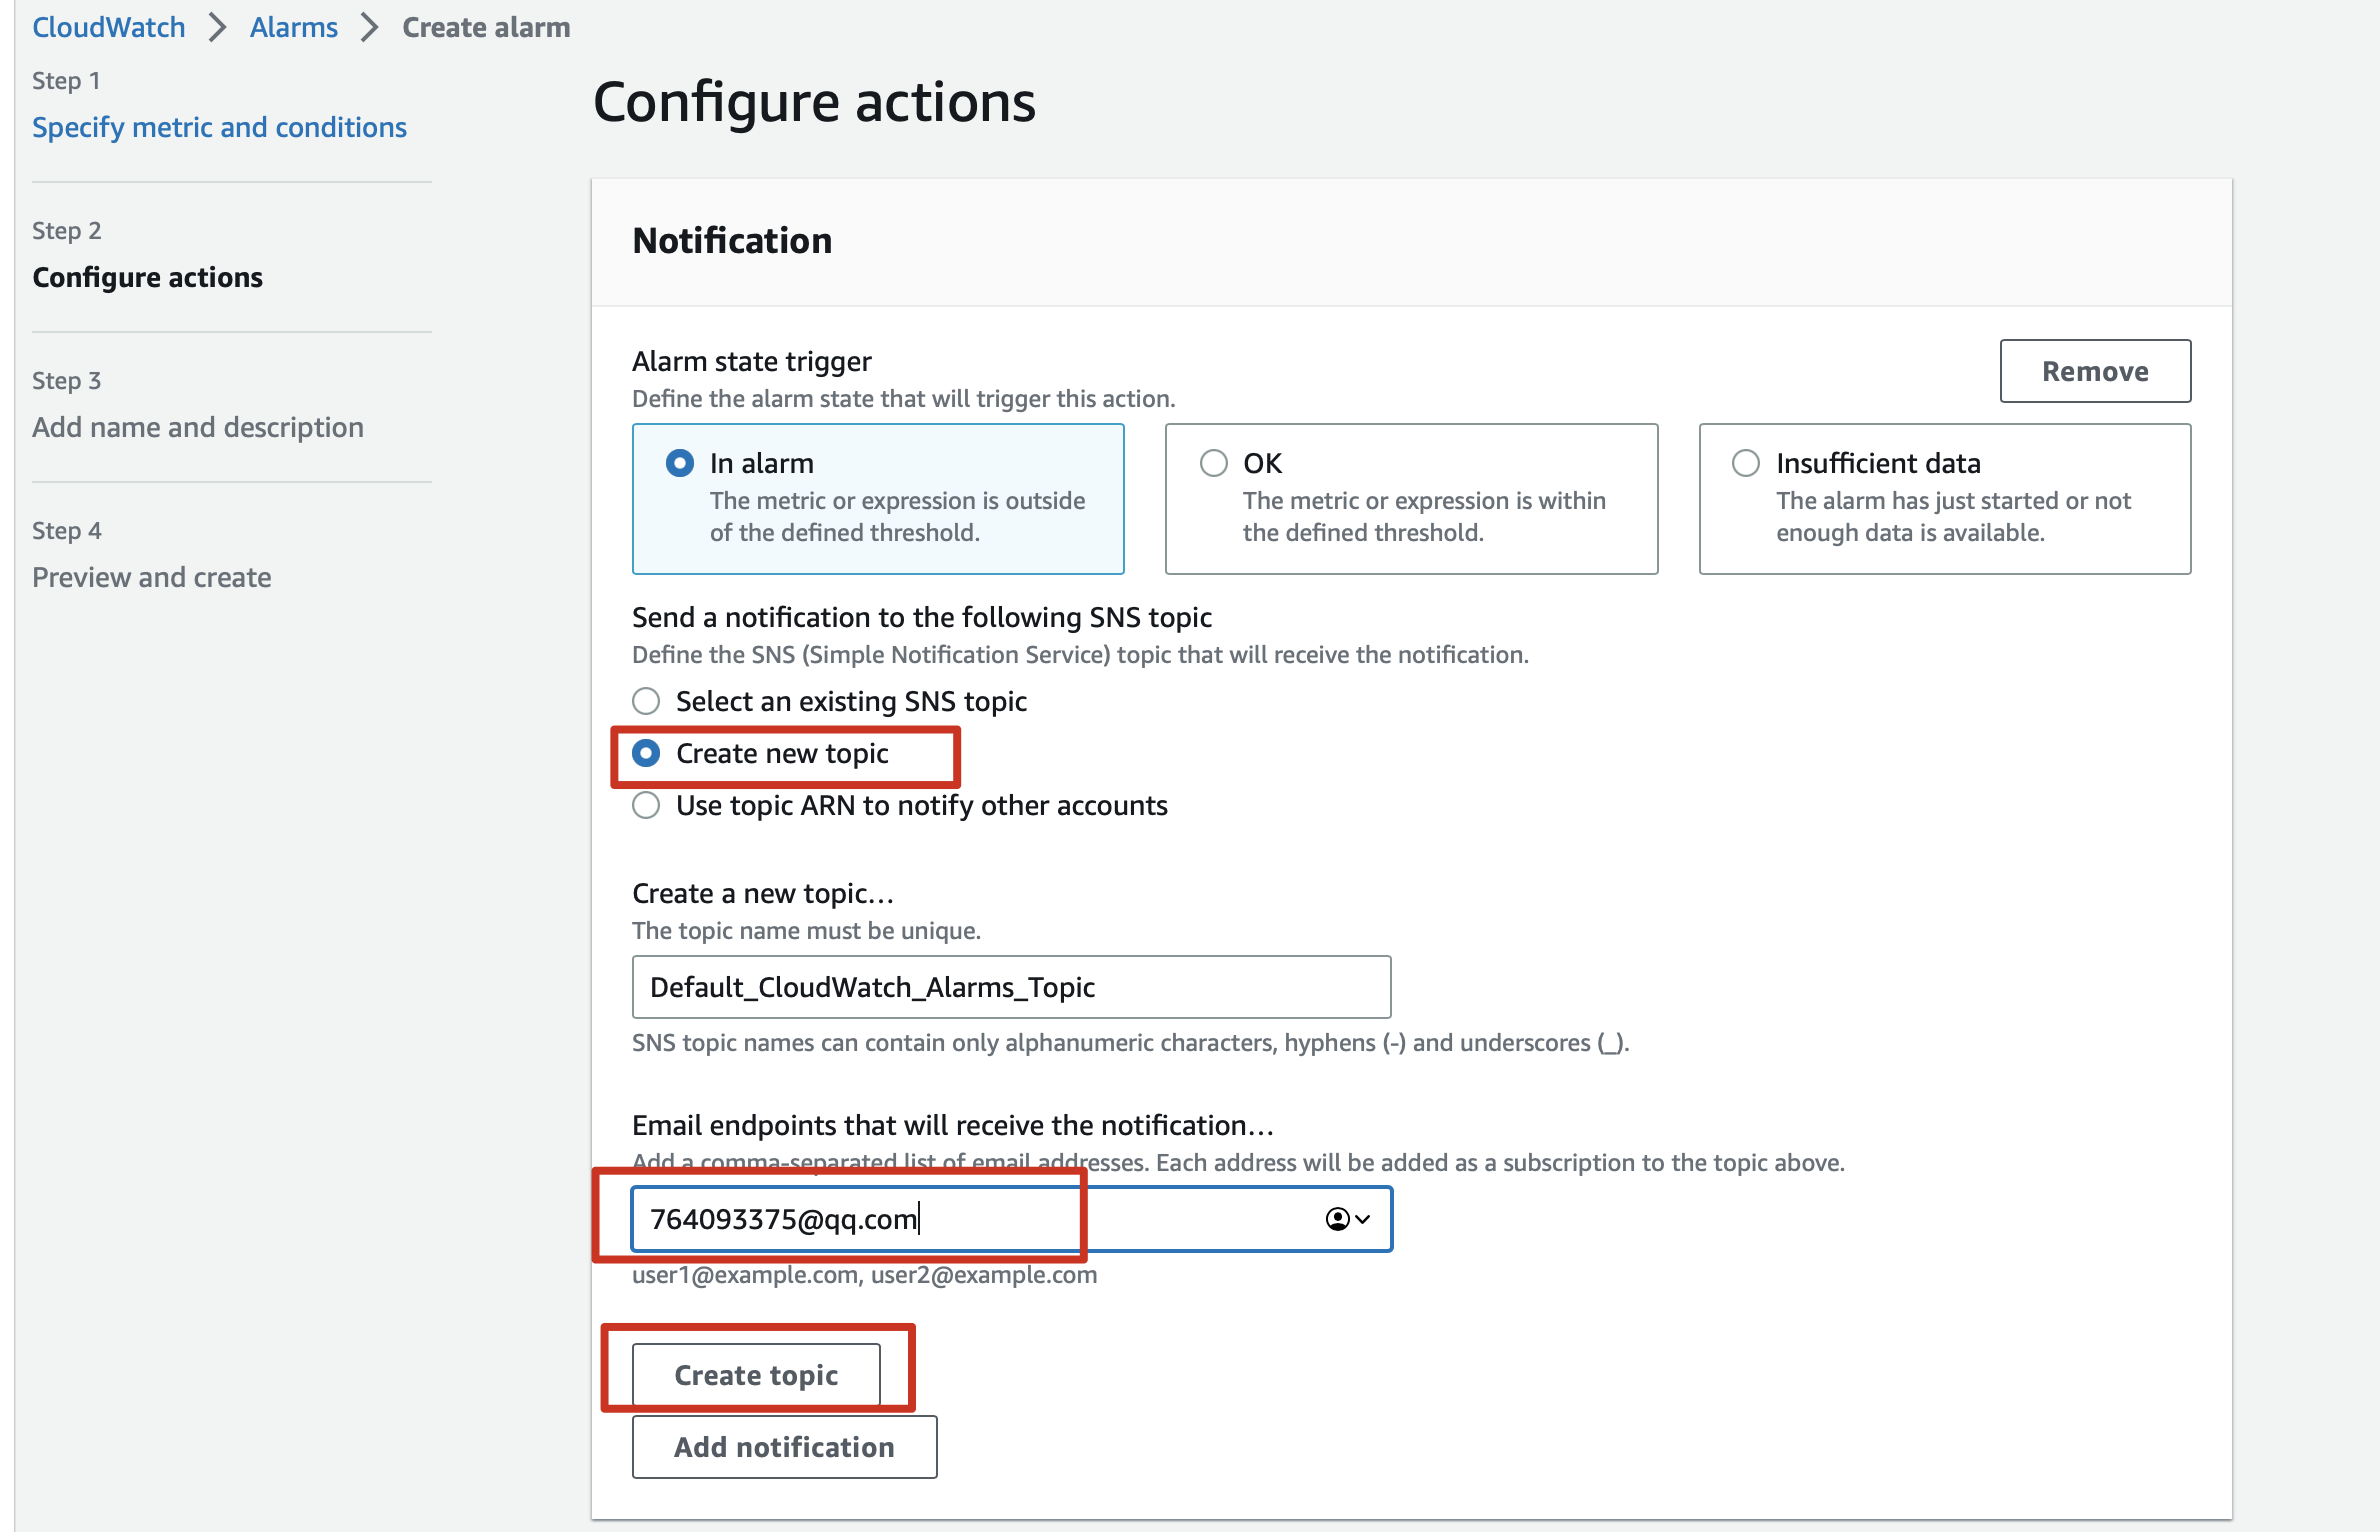
2.4 Setting the form of the trigger notification
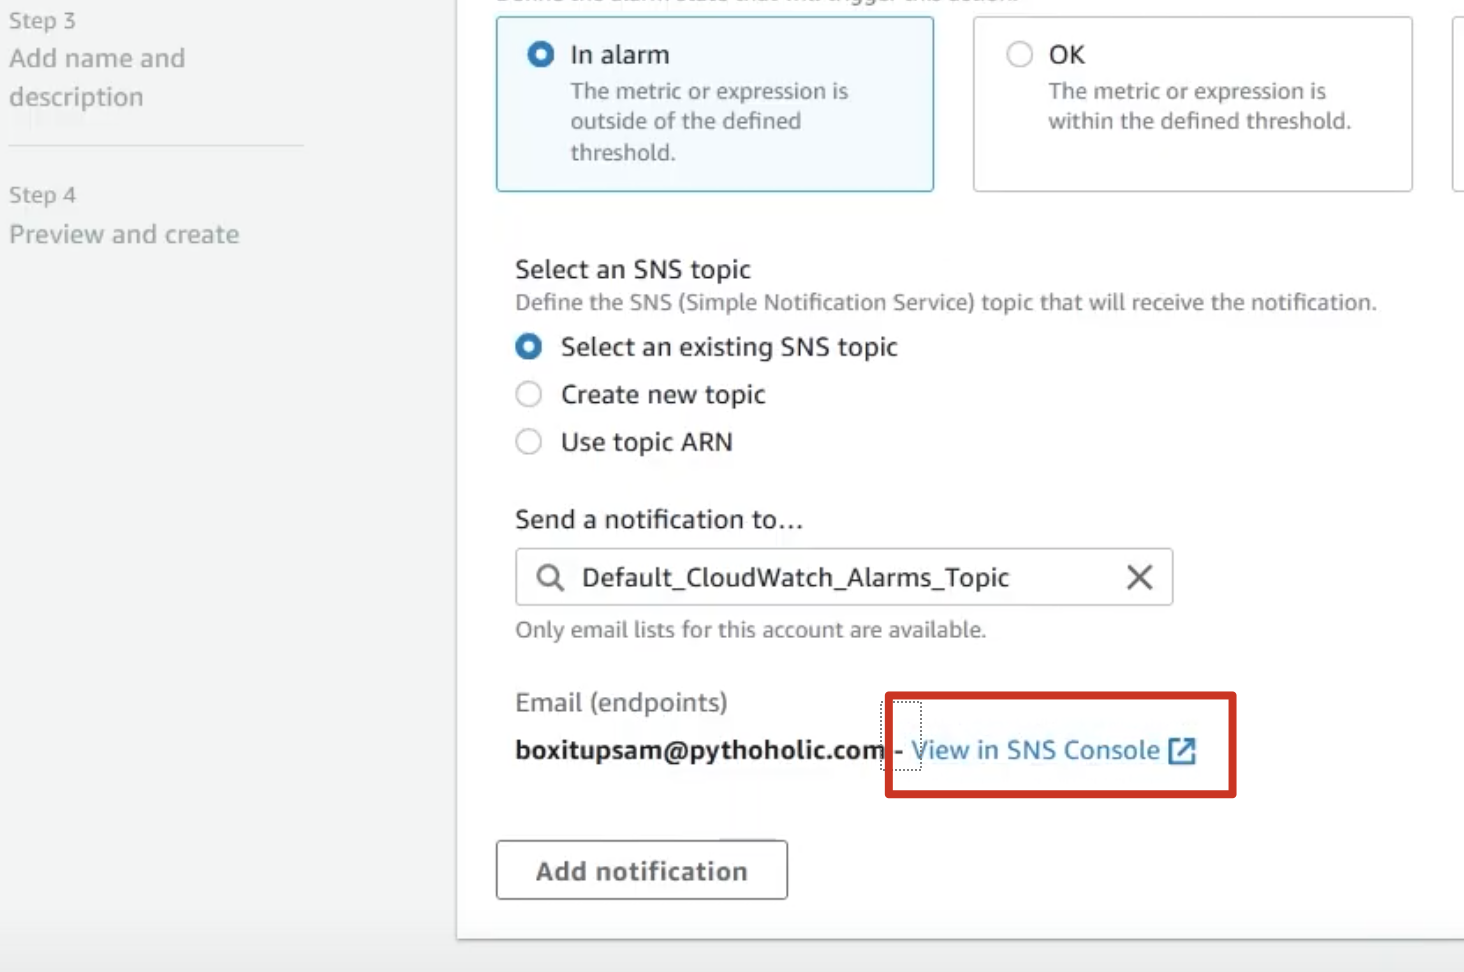
2.5 Checking if an email is CONFIRMED
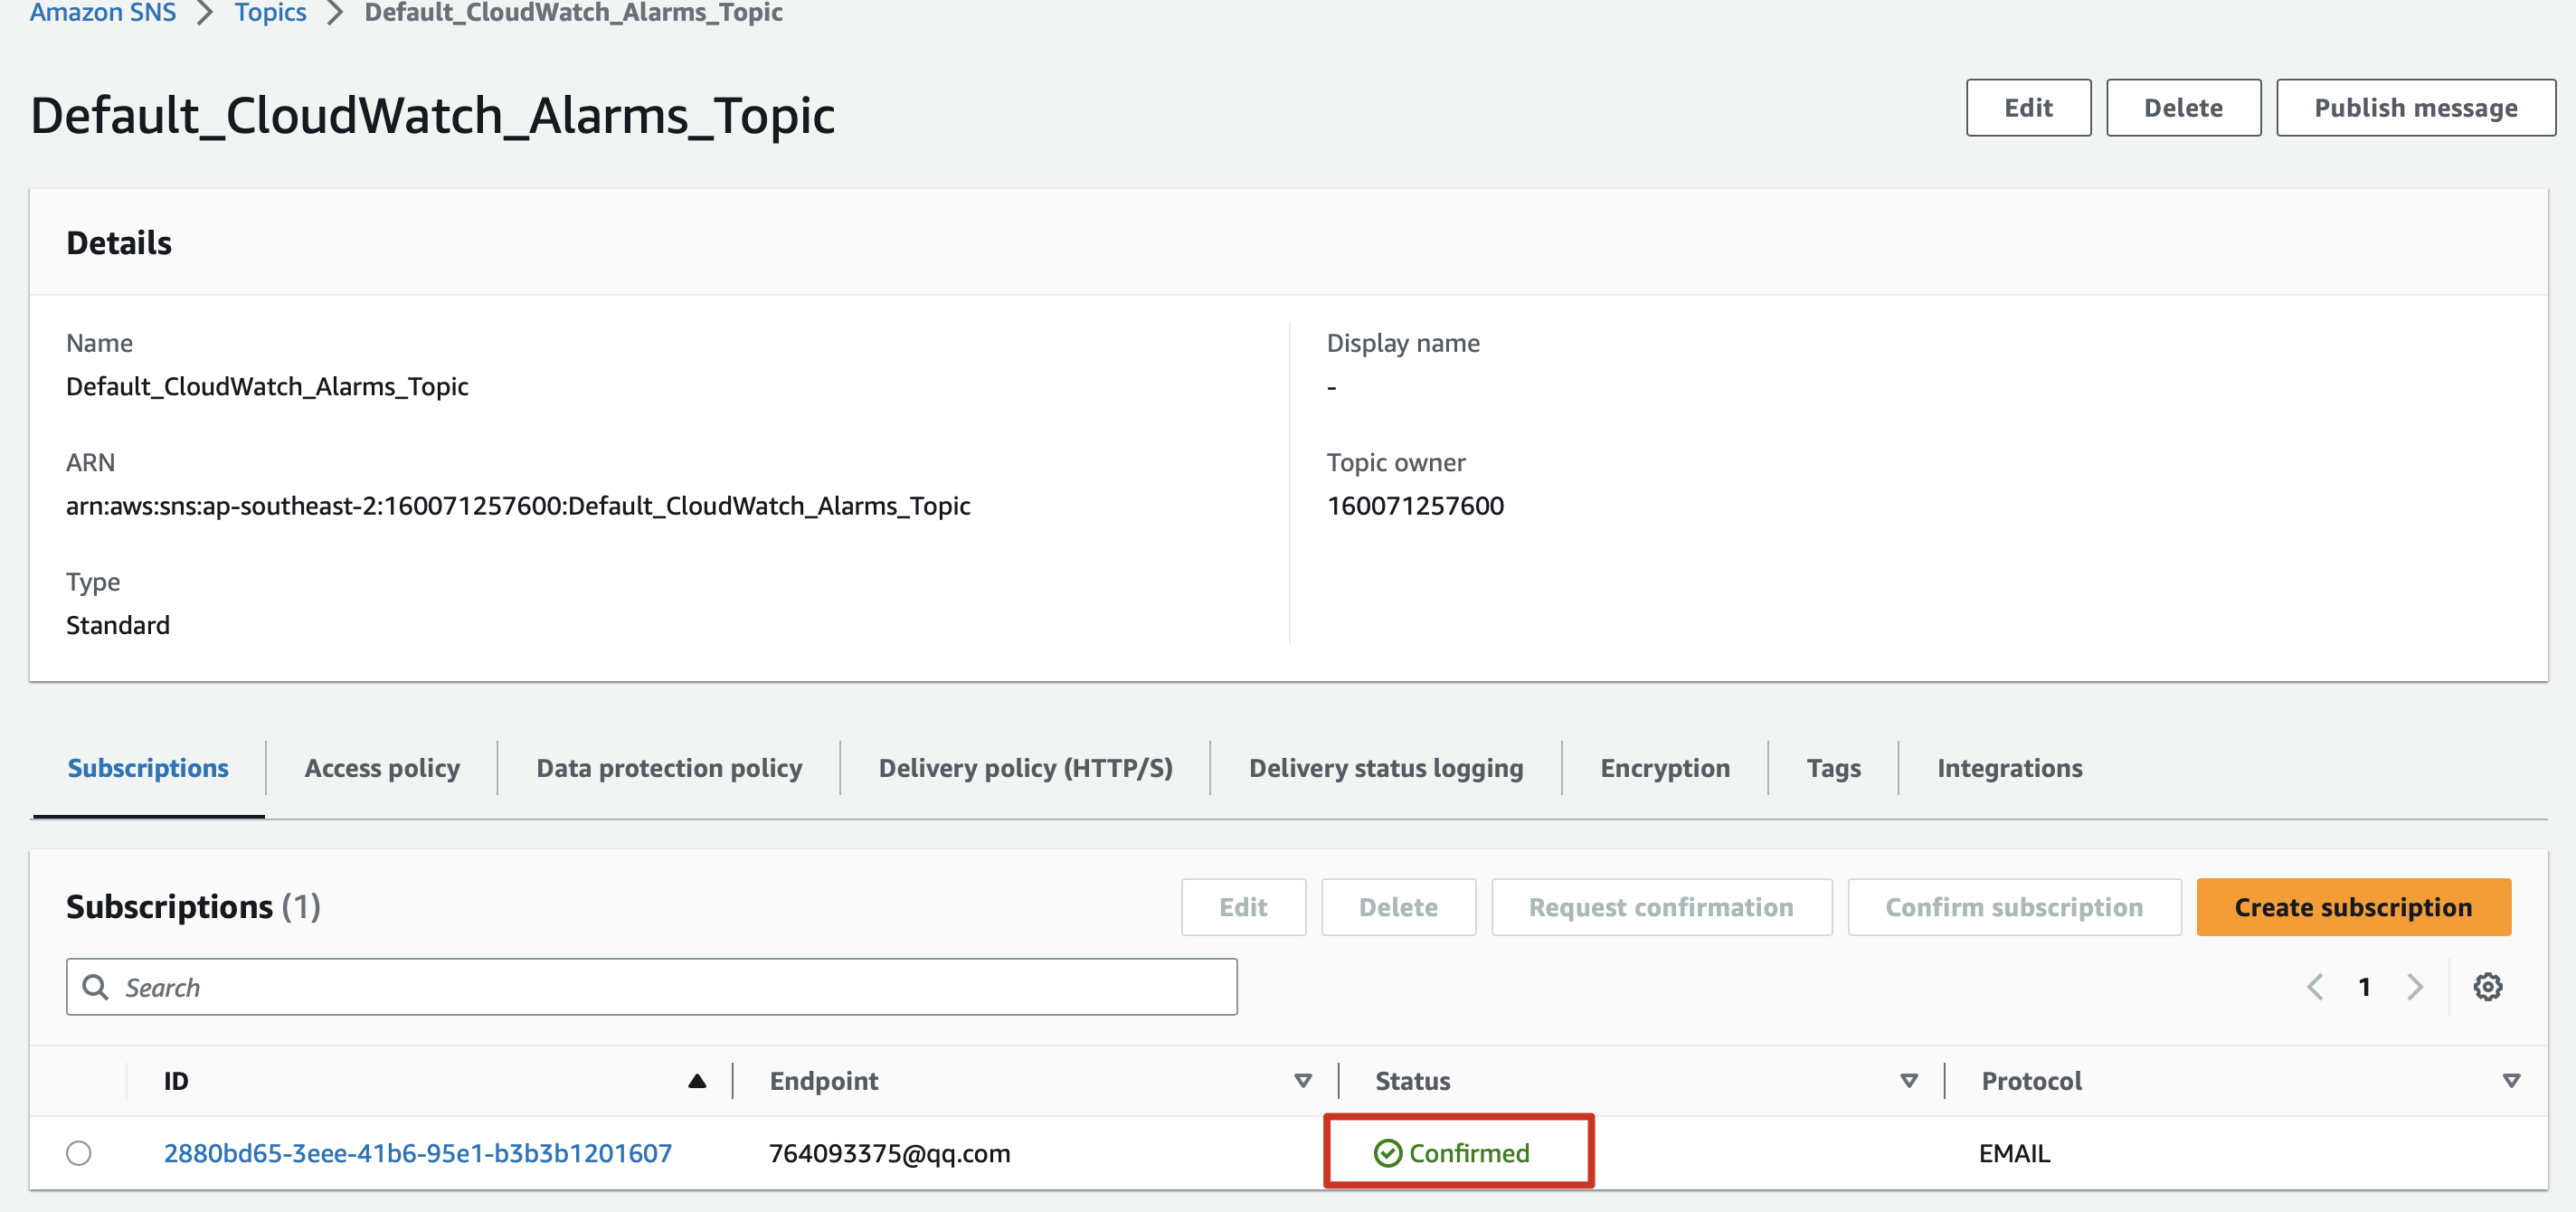
2.6 Next then given a name click next
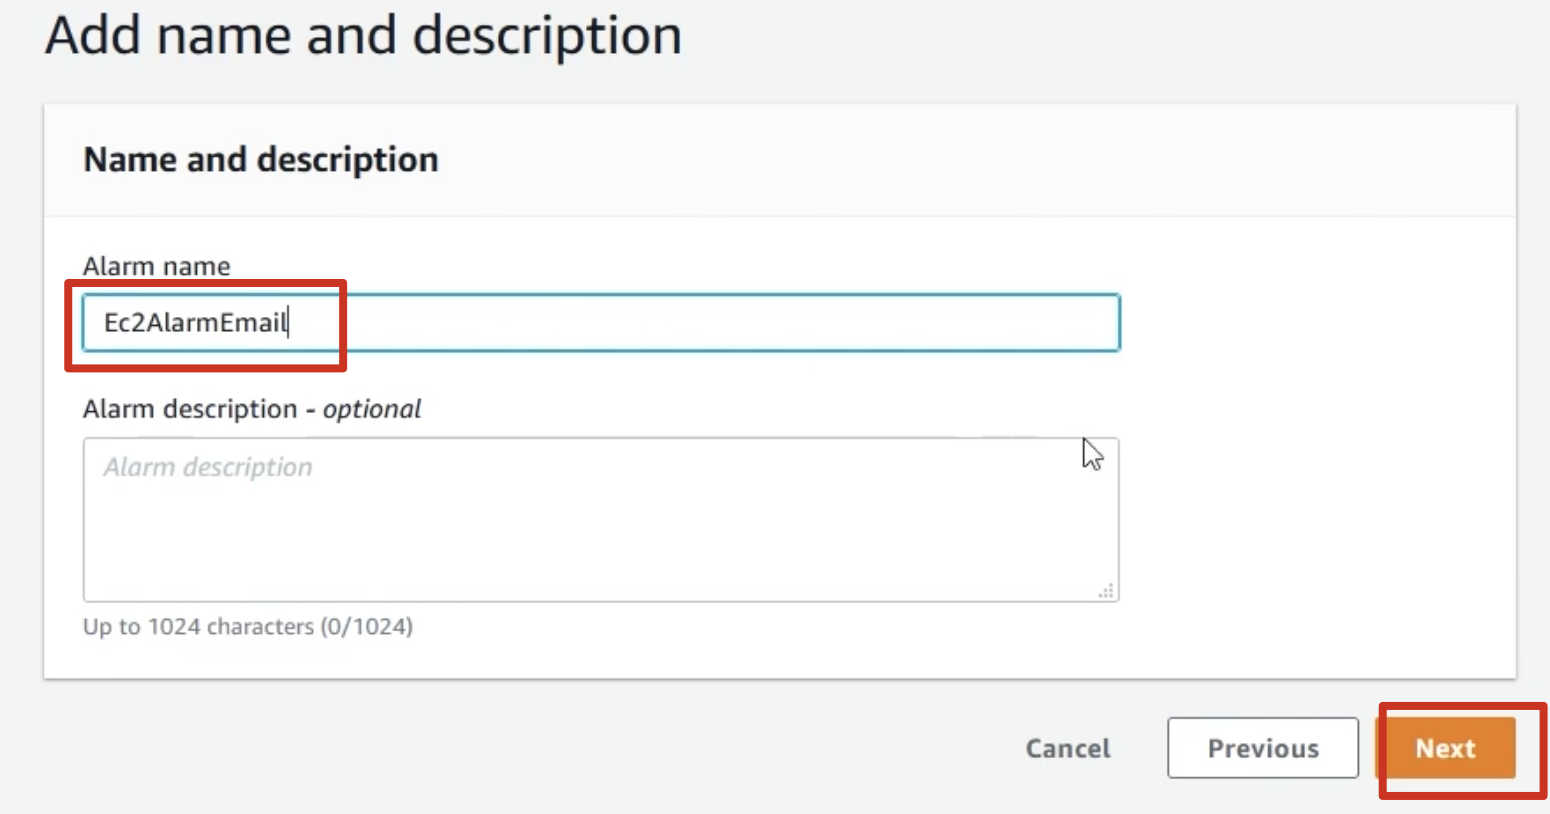
Step 3: Add a dashboard to this alarm
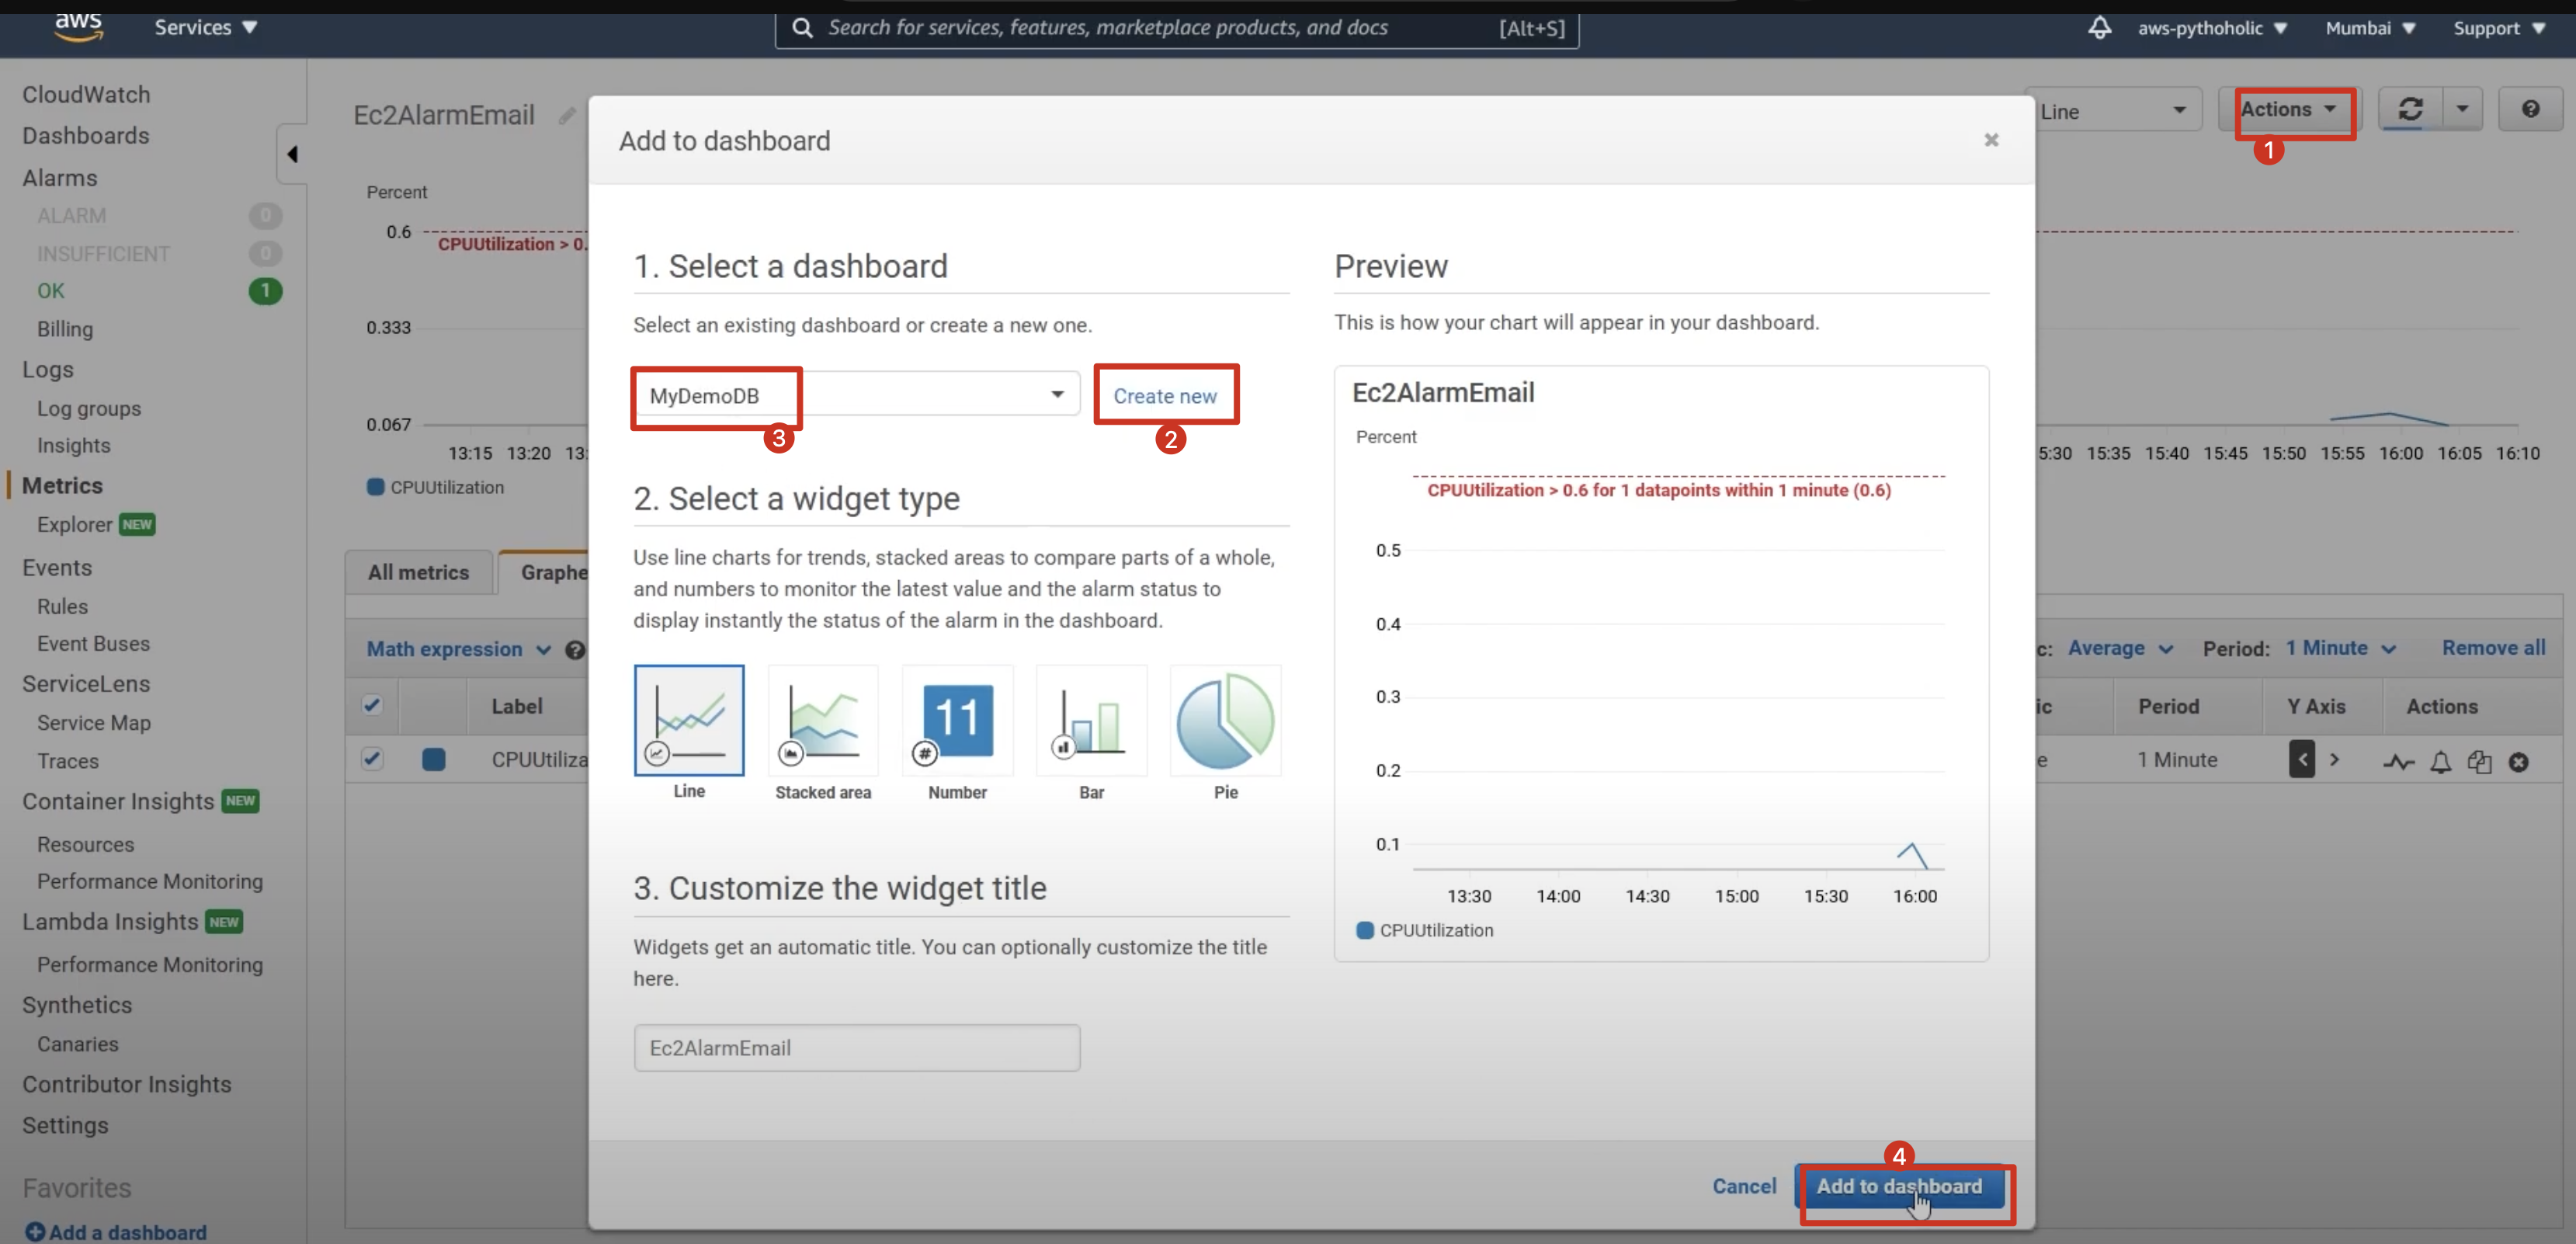
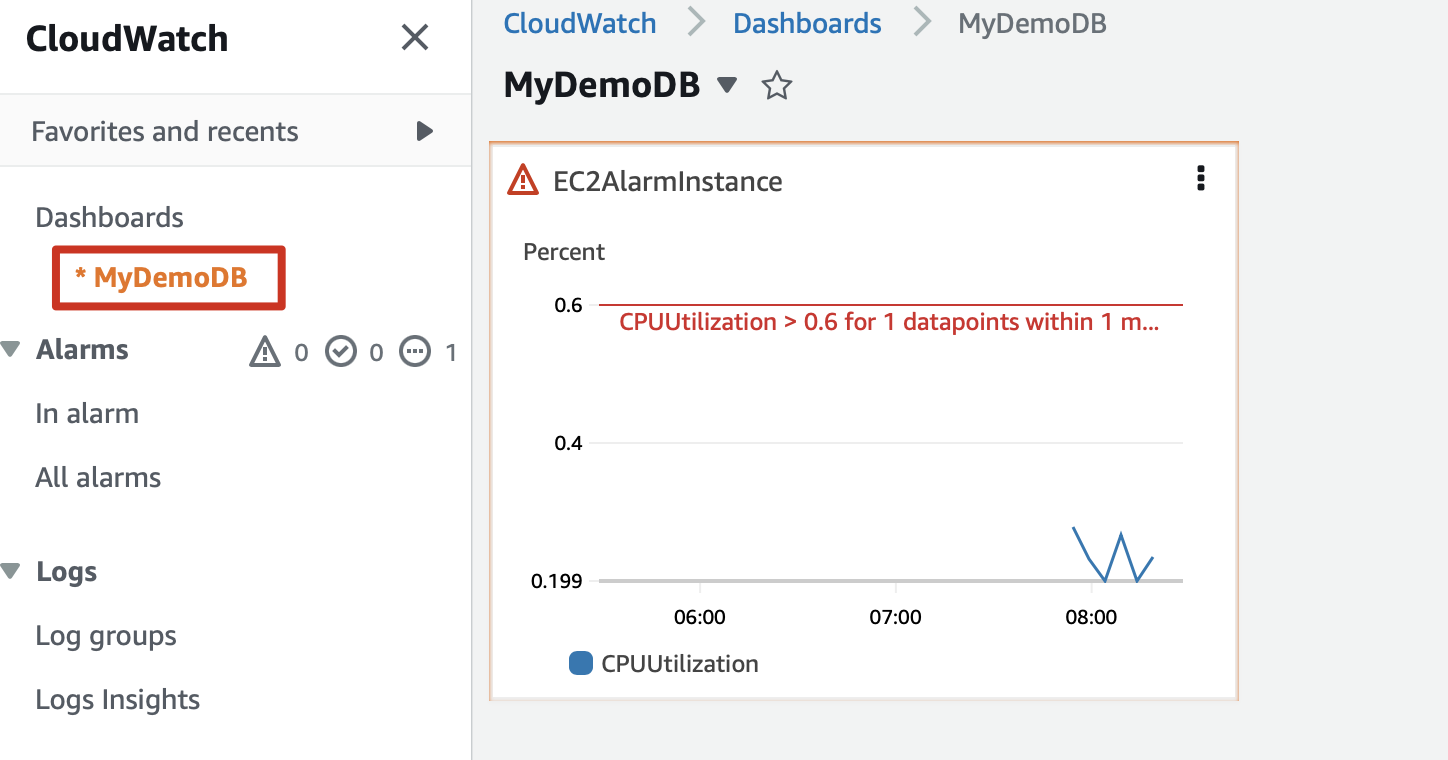
Step 4: Increase the CPU utilization of the program using stress
Previously the threshold was set too low, you can set it to 10.
Installers in the terminal - update the epl repository first.
sudo amazon-linux-extras install epel -yThen install stress
sudo amazon-linux-extras install epel -y ```bash
sudo yum install stress
stress --help
stress --cpu 2 --timeout 60Should have sent a warning
stress --cpu 4 --timeout 180Step 5: Cleaning up created resources
Clear the alarm
SNS Topic
Clear the instance
s3 resources
![[AWS CloudWatch] How to create a alarm?](/api/files/1710996593988.jpg)